What we did#
On 19 August 2026 we took the
Tranco top-1 million list
published 17 August 2026 (list ID K9L5W), filtered it to
every domain ending in .au — 8,376 of them — and
requested each homepage once over HTTPS, parsing the head with the same engine behind
the checker on our homepage. 6,445 returned a page we could measure,
and every percentage below is a share of those.
The rest are excluded rather than counted as failures of the sites themselves.
1,753 never returned a page —
633 blocked (http 403), 217 timed out, 241 tls problem, 352 not publicly resolvable, 85 other http error, 225 other.
A further 178 answered with HTTP 200 but served a bot challenge rather than a
real page: no title, no description, no images, no headings. We identify ourselves honestly
in the User-Agent instead of impersonating a browser, and some sites answer that with an
interstitial — amazon.com.au returns two kilobytes containing
<title> </title>. Counting those as "has no meta description"
would be false, and would bias the whole report against exactly the large sites most likely to
sit behind a firewall, so they are excluded and counted here instead.
Title tags#
Search engines truncate titles at roughly 60 characters. Under 30 usually means the title is doing no work at all.
Meta descriptions#
Google rewrites descriptions often enough that a missing one is not fatal — but it hands the decision entirely to the search engine.
The tags almost everyone gets right, and the ones almost nobody does#
2,141 homepages (33.2%) have no Open Graph tags at all. Every time one of those is shared to Facebook, LinkedIn, Slack or iMessage, the platform guesses — usually badly — at a title, a description and an image. It is the cheapest fix on this page and the most visible when it is missing.
Headings#
One H1 per page is the convention. Both zero and several are common enough to be worth counting rather than assuming.
Alt text#
We counted 358,471 images across 6,141 homepages that carry any. 132,897 of them (37.1%) have no alt attribute. Only 1,077 homepages (17.5% of those with images) get every image labelled.
This is the one number here that is an accessibility problem before it is an SEO problem. A screen reader announces an unlabelled image by its filename, or skips it.
Grades#
The grade each homepage would receive from the checker on our homepage, using the identical grading code.
What Australian websites are built with#
Read from the generator meta tag. Only 948 of the
6,445 homepages we fetched (14.7%) name a platform we recognise —
most sites publish no generator tag at all, and some platforms deliberately omit it. So this is
a picture of the sites that announce themselves, not of the whole population, and the shares
below are of those 948 domains only.
Does the platform decide the outcome?#
The same measurements, split by the platform a site declares. A CMS that ships good defaults should show up here.
| Platform | Domains | Description | Open Graph | Canonical | Grade A or B |
|---|---|---|---|---|---|
| WordPress | 271 | 62.0% | 36.9% | 91.1% | 22.9% |
| Elementor | 264 | 75.4% | 65.5% | 98.5% | 43.2% |
| Drupal | 250 | 52.0% | 15.2% | 98.4% | 13.6% |
| HubSpot | 37 | 97.3% | 54.1% | 100.0% | 64.9% |
| Webflow | 27 | 96.3% | 3.7% | 59.3% | 11.1% |
| Gatsby | 26 | 88.5% | 26.9% | 69.2% | 26.9% |
Platforms with fewer than 25 declaring domains are omitted.
By type of Australian domain#
Australian domains are sorted into namespaces by who is allowed to register them:
com.au for
businesses, gov.au for government bodies, edu.au for accredited
education, and so on. Each row below is one of those categories, not a website.
Nothing is published at gov.au itself — that row is the
304 government domains we measured,
from ato.gov.au to health.gov.au. Domains registered straight at the
second level, like example.au, are counted as au (direct).
| Namespace | Domains | Description | Open Graph | Canonical | Viewport |
|---|---|---|---|---|---|
com.au |
4,870 | 83.6% | 44.8% | 79.2% | 95.4% |
au (direct) |
506 | 94.5% | 5.7% | 94.7% | 98.8% |
org.au |
353 | 72.8% | 43.1% | 77.6% | 97.7% |
gov.au |
304 | 59.5% | 26.0% | 75.3% | 96.4% |
edu.au |
201 | 78.1% | 41.8% | 86.6% | 99.0% |
net.au |
195 | 72.3% | 35.4% | 65.1% | 83.1% |
Namespaces with fewer than 25 measured domains are omitted, on the same threshold as the platform table above.
Methodology#
- Population
- Every domain ending in
.auin the Tranco list published 17 August 2026 (IDK9L5W, permanently retrievable at https://tranco-list.eu/list/K9L5W) — 8,376 domains, the whole.ausubset rather than a sample. - Measurement
- One HTTPS GET of
https://<domain>/per domain, following up to five redirects, with a 15-second timeout and a 2 MB cap on the HTML parsed. We identify ourselves in the User-Agent. Only the homepage is measured, so this describes front doors, not whole sites — and a homepage is usually the most carefully tuned page a site has, which means these figures are likely the optimistic end of each site's practice. - Denominators
- Unless stated otherwise, percentages are a share of the 6,445 homepages we measured, not of the 8,376 in the list. Domains that failed to respond, and those that answered with a bot challenge, are excluded rather than counted as missing tags — counting a blocked request as a missing description would understate the whole population and would do it unevenly.
- The bot-challenge exclusion, and its risk
- A challenge page returning HTTP 200 is indistinguishable from a real page except by its contents, so we classify a response as a challenge when it has an empty title AND no description AND no Open Graph AND no images AND no H1 — five things a genuine homepage essentially never lacks at once. This is a heuristic, not a certainty. It will misclassify a truly empty holding page as "blocked", and it will miss a challenge page that happens to carry a title. We would rather exclude a handful of genuinely bare pages than publish an aggregate quietly dragged down by pages we were never shown. The error runs in one direction only. Because the test is built from the same fields we report on, every excluded page is by construction one that lacks them, so any genuine page caught by it lowers the "missing" figures and never raises them. That error has a ceiling: if all 178 exclusions were real pages, homepages with no meta description would rise from 17.9% to 20.1%, and the missing-title, no-Open-Graph, no-image and no-H1 shares would move by a similar margin. The next edition will identify challenges by what they contain (challenge scripts, widget markup and response headers) rather than by what they lack. Thanks to the Tranco team for pointing this out.
- Alt text counts images, not decisions
- We count
imgelements with noaltattribute. An emptyalt=""is the correct, deliberate markup for a decorative image and is counted as present, not missing. CSS background images and inline SVG are not counted at all. - Why there is no structured data section
- The engine behind this report does not parse JSON-LD or microdata, so we have no honest measurement of schema.org adoption to publish. Rather than infer it from something adjacent, we have left it out. It is the obvious next thing to add.
- Platform detection is a floor
- Read from the
generatormeta tag only. We do not fingerprint scripts, paths or headers. Most sites publish no generator tag, and several platforms strip it, so the platform counts describe self-declaring sites and understate every platform — some far more than others. Do not read them as market share. - Point in time
- A single fetch per domain on 19 August 2026. A site mid-deploy, geo-serving different markup, or rendering its head in JavaScript after load may be measured differently than a browser would see it.
- How often it runs
- This is the 2026 edition, and the intention is to repeat it annually against a fresh Tranco list so the figures can be compared year to year. The scan and aggregation are scripted, so a re-run measures the same things the same way — the interesting number is not any single year's percentage but which of them move.
- Reproducing it
- The aggregated results are published as JSON under a CC BY 4.0 licence. The Tranco list ID pins the exact input, and the scanning code is the same engine behind the homepage checker, so any domain in the set can be re-checked by hand.
Charts you can reuse#
Two of the findings above as standalone images, each carrying its own source and licence so it stays attributable once it has been passed along. Right-click to save, or hotlink them — we will not move the URLs.
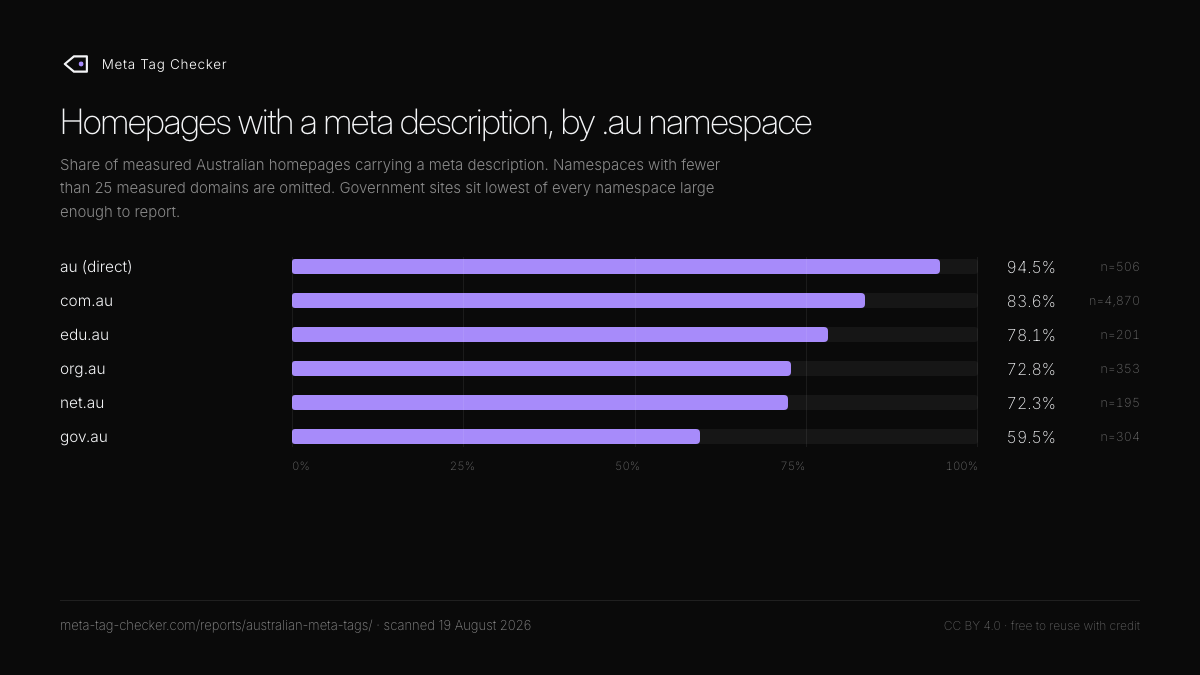
.au namespace — government sites sit lowest
of every namespace large enough to report.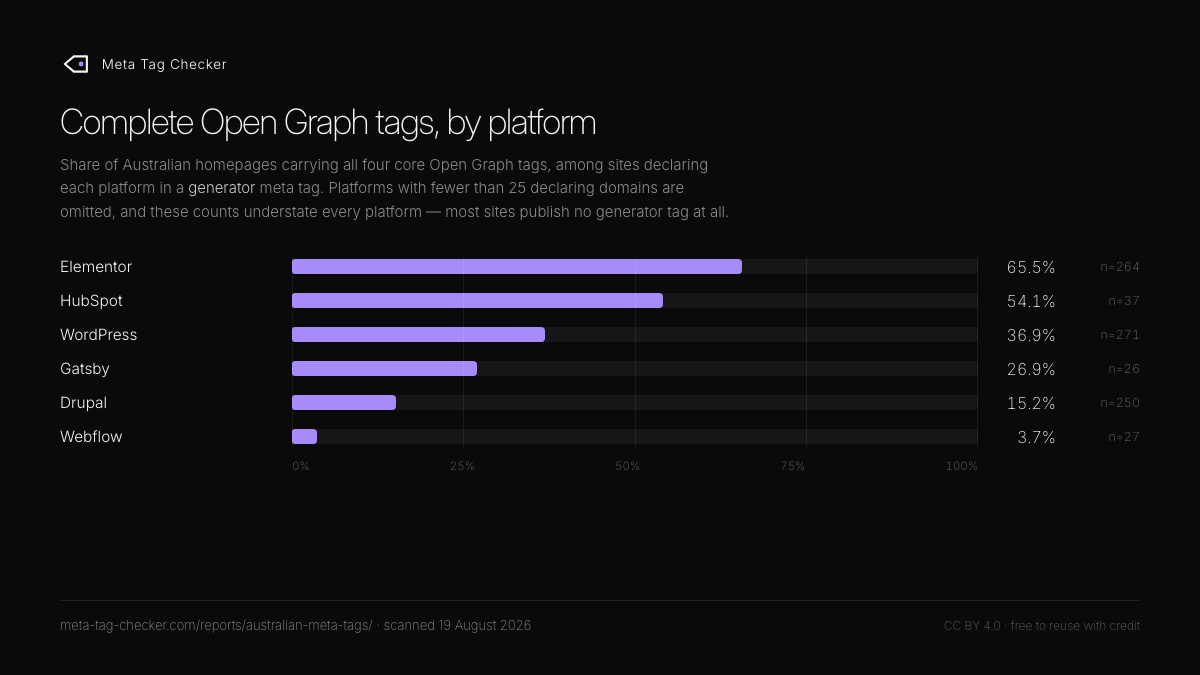
Cite this report#
Every figure here is free to reuse, republish and build on — including commercially — under a Creative Commons Attribution 4.0 licence. All it asks is a credit and a link back.
Williams, J. (2026). What Australian websites actually put in their meta tags. Meta Tag Checker. https://meta-tag-checker.com/reports/australian-meta-tags/
The complete aggregated dataset behind every chart on this page is published as JSON. Writing about one of these findings and want a cut of the data we have not charted, or the figures behind a specific number? Ask — we will send it.
Corrections welcome. If a domain here is measured wrongly, or you can see a methodological problem we have missed, tell us and we will correct the page and say what changed.